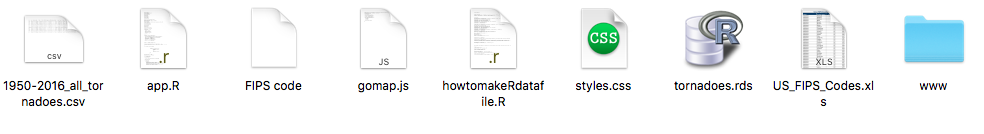
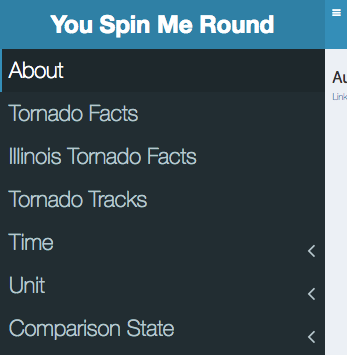
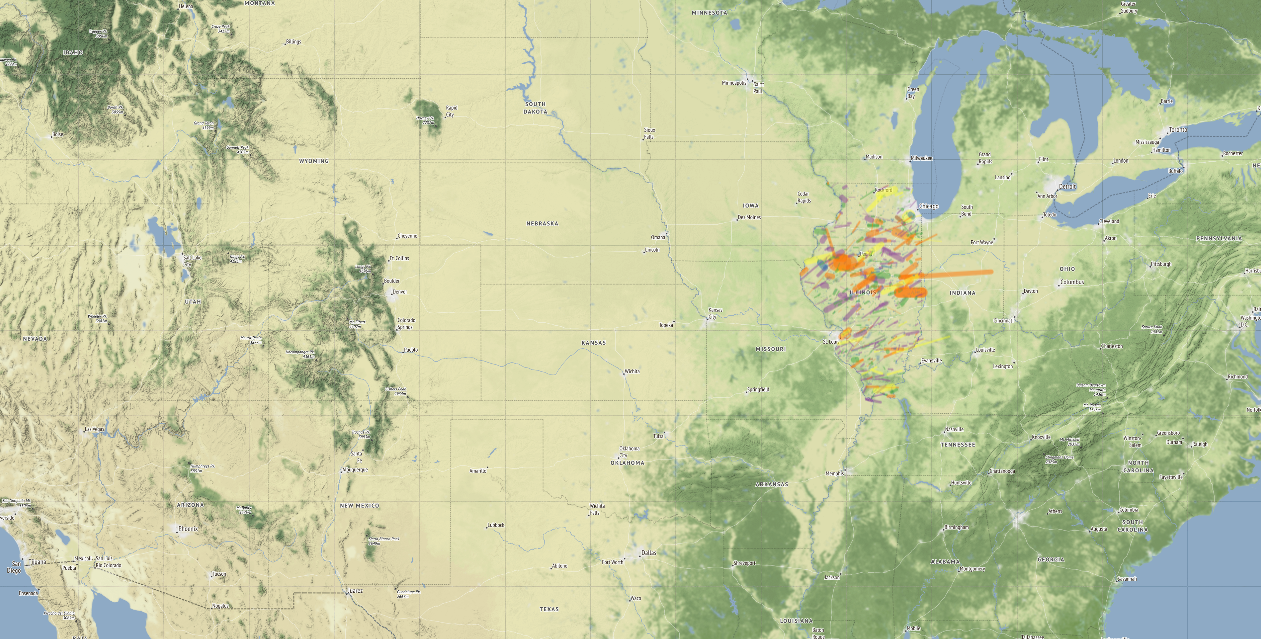
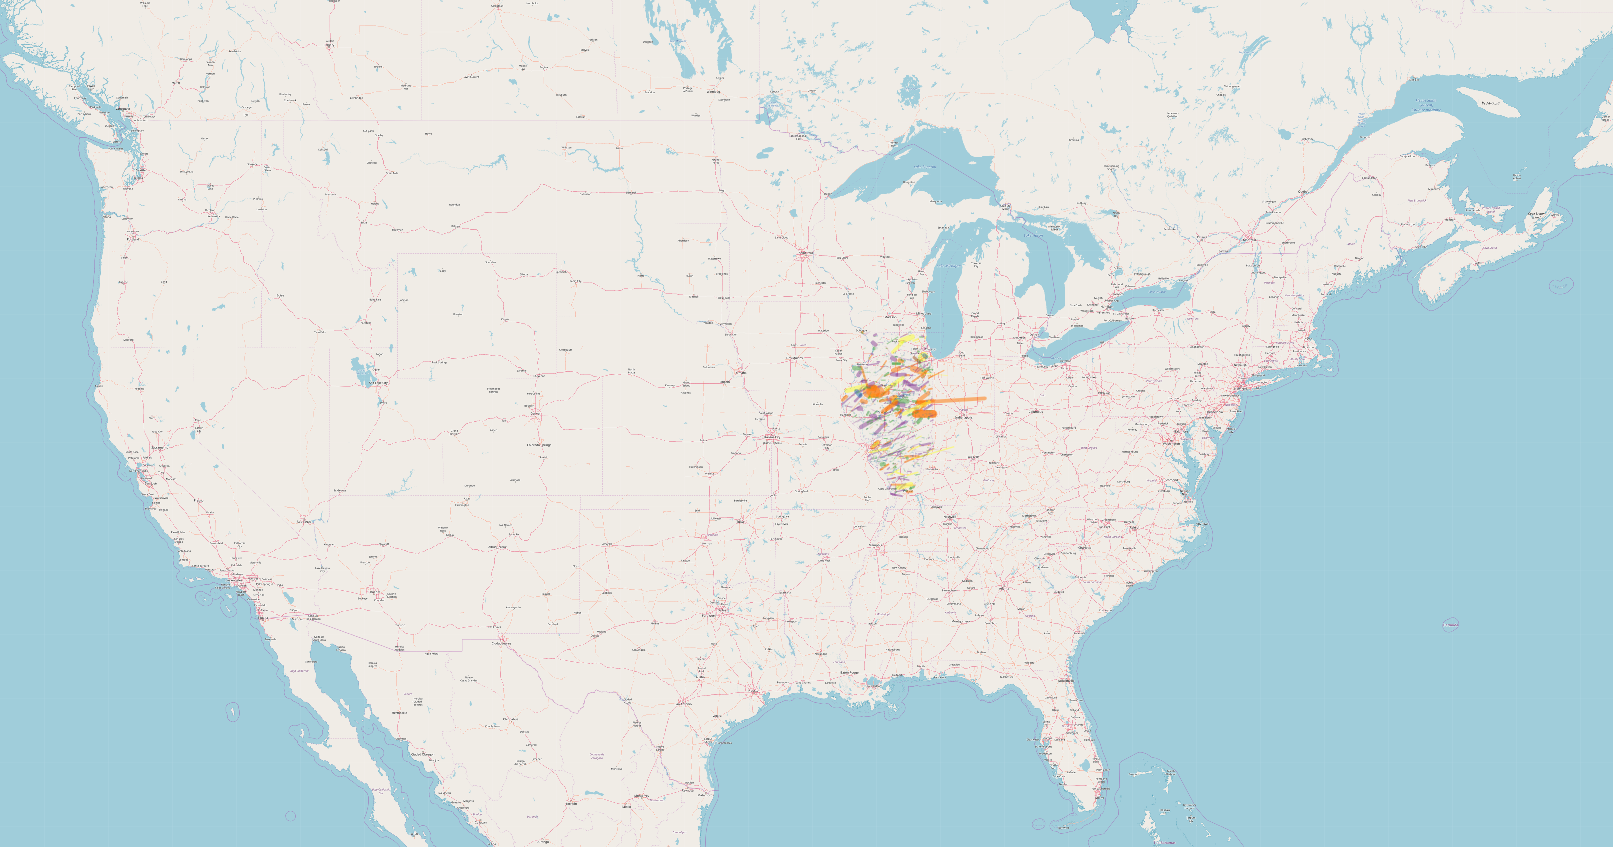
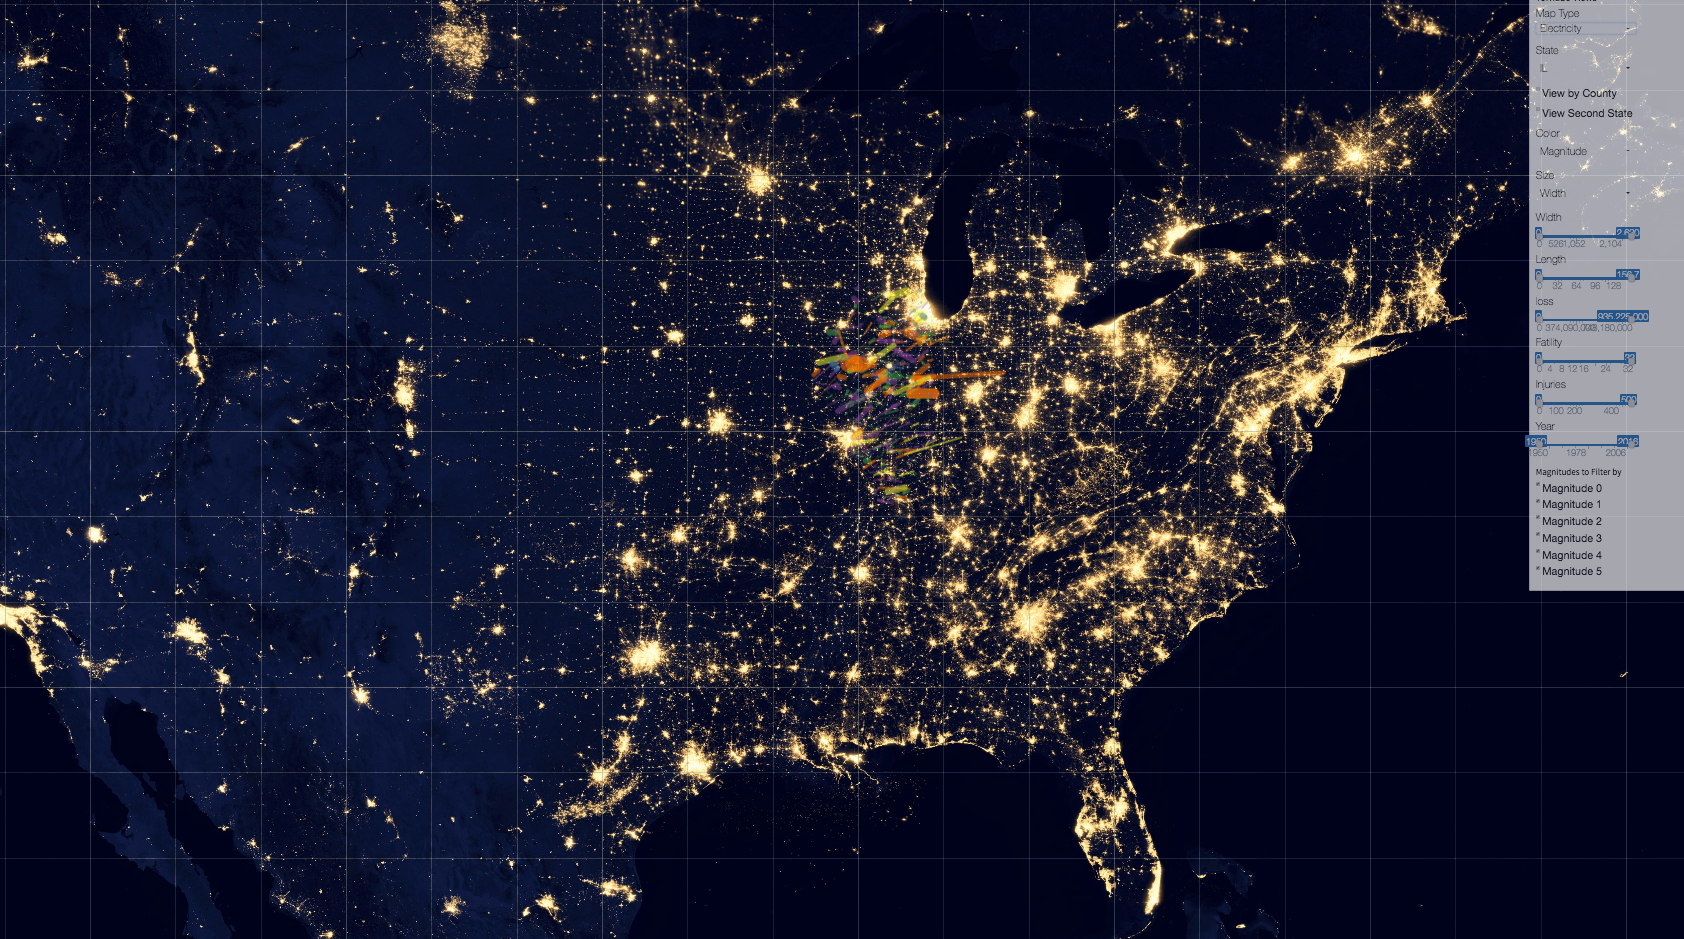
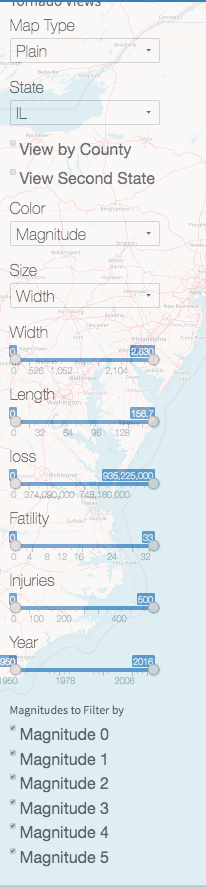
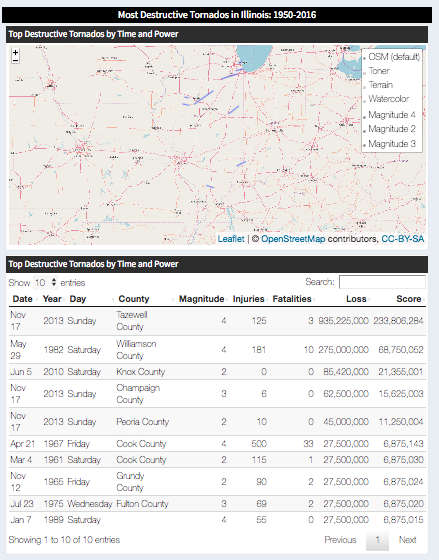
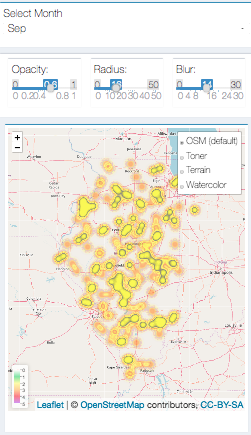
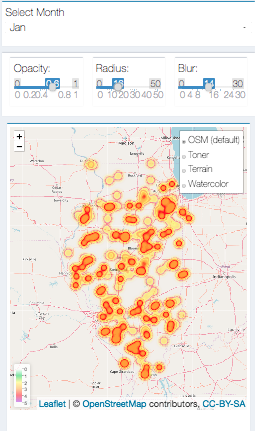
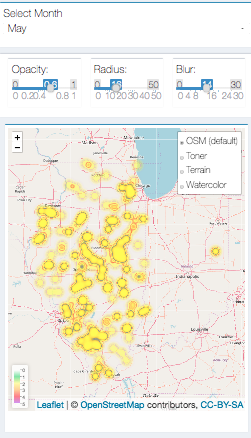
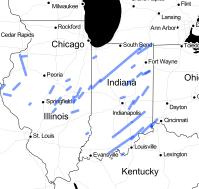
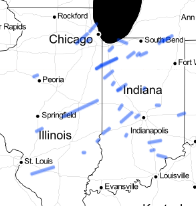
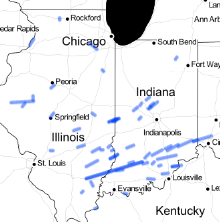
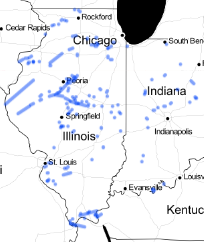
Project 3 will be on visualizing data with a strong geographic component, in particular tornadoes in Illinois.
View Alpha Release
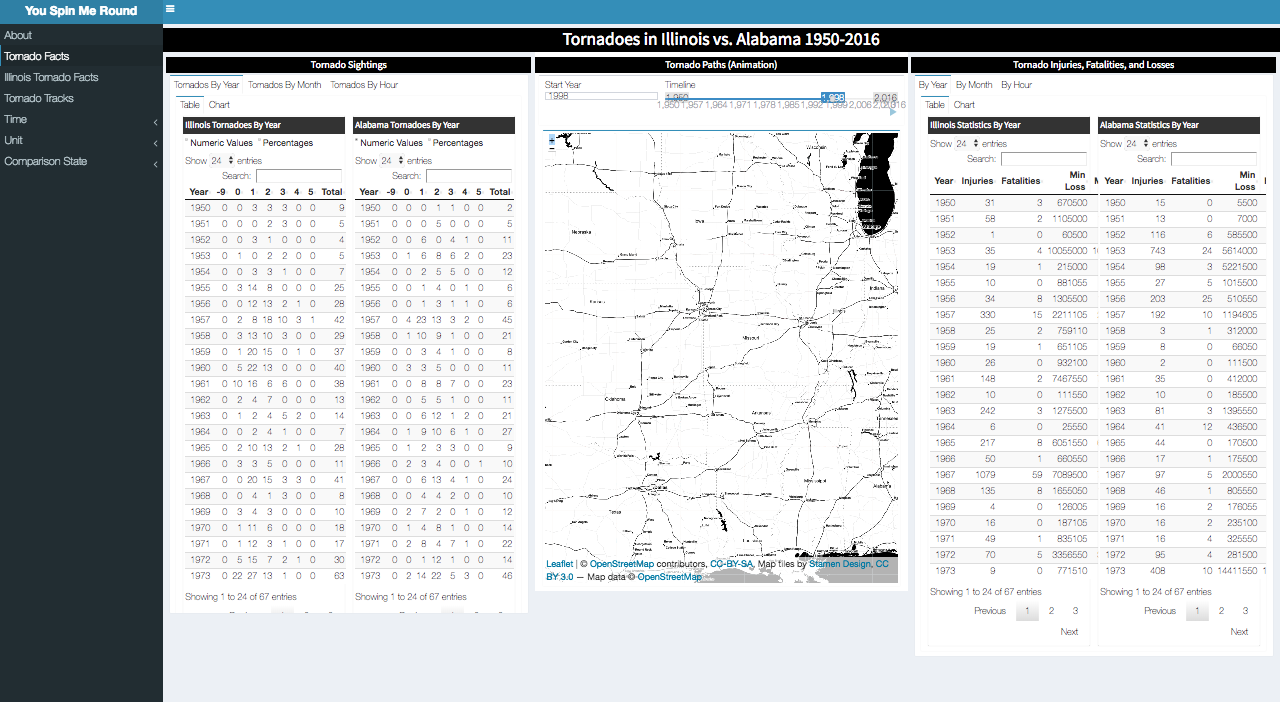
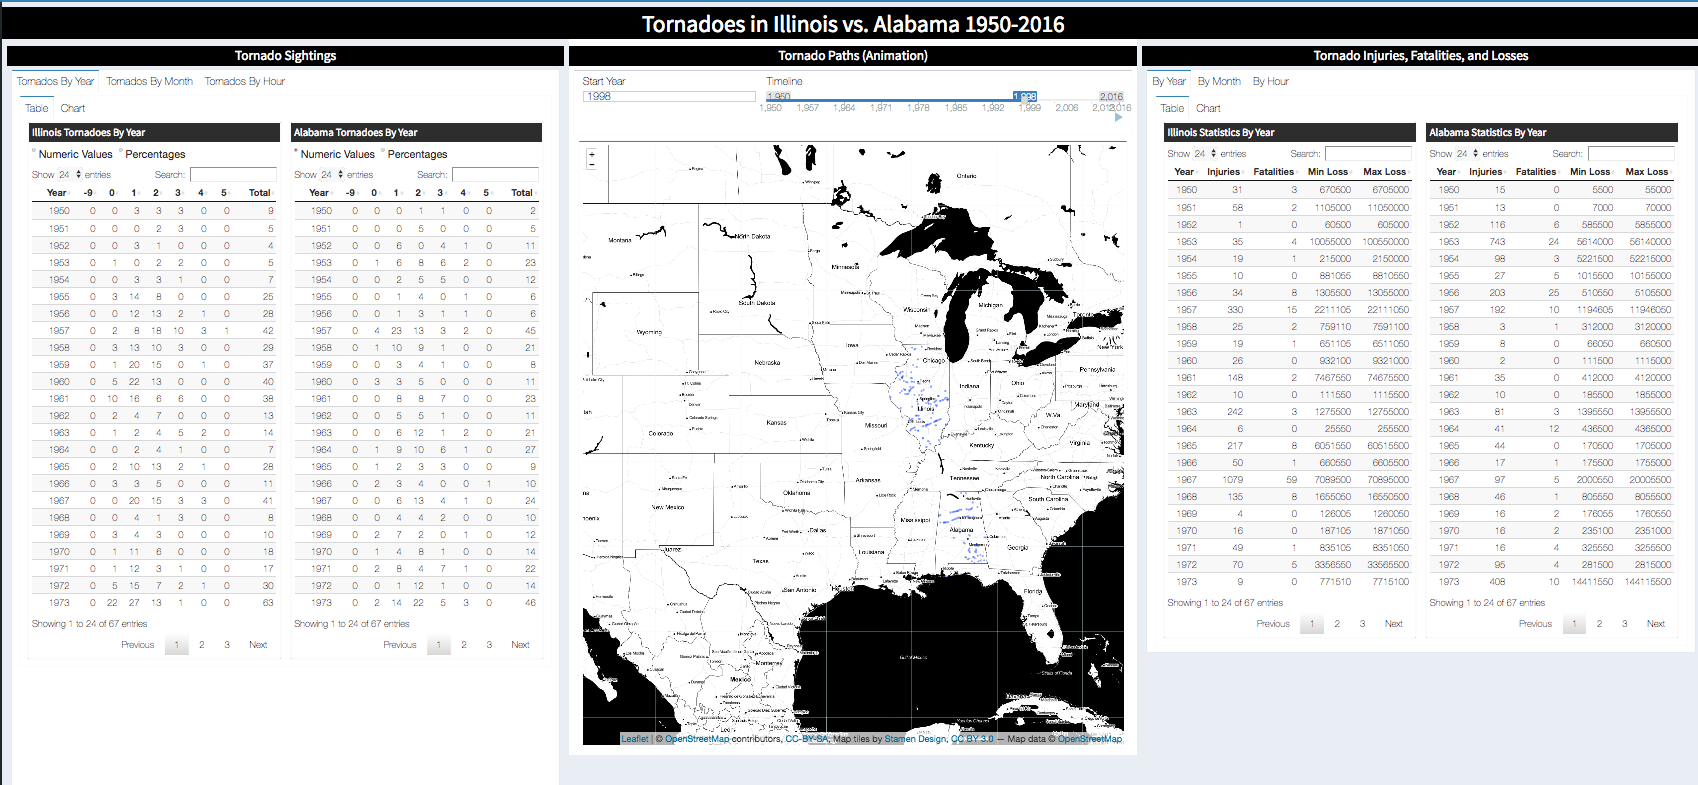
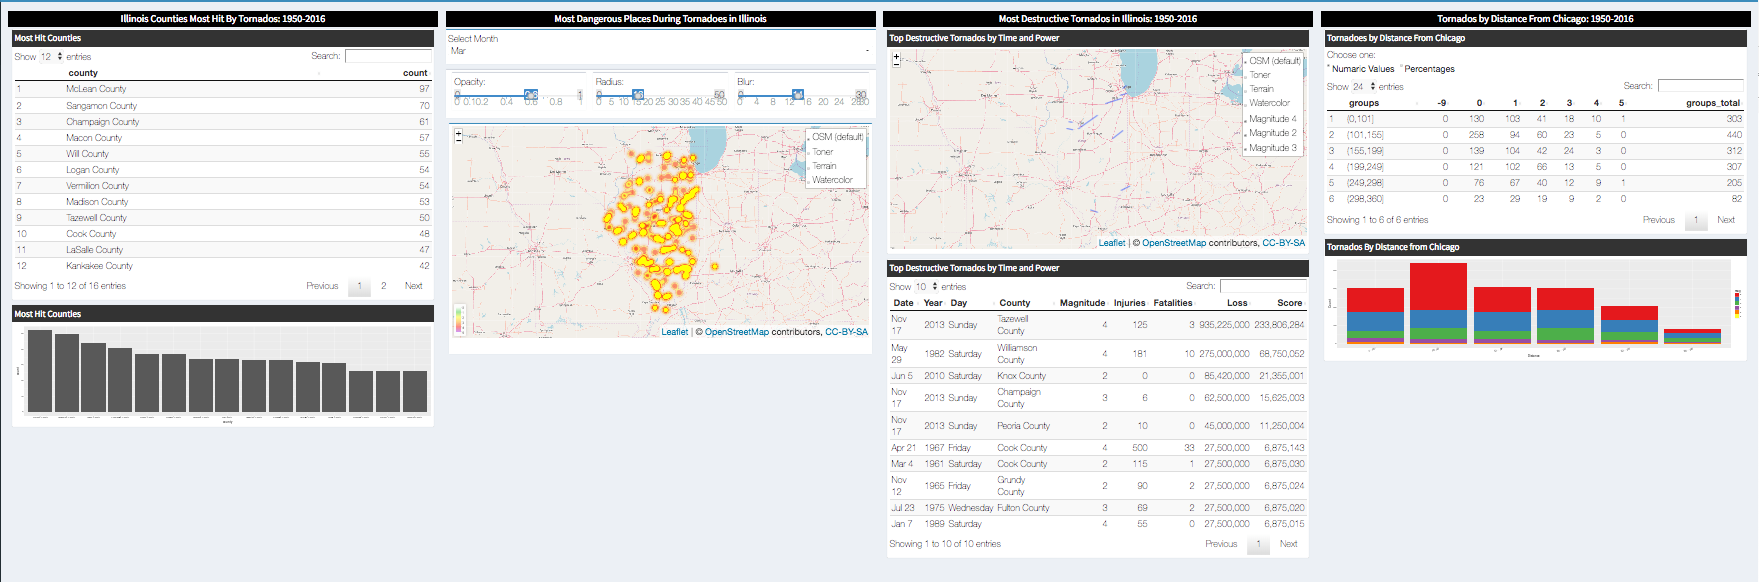
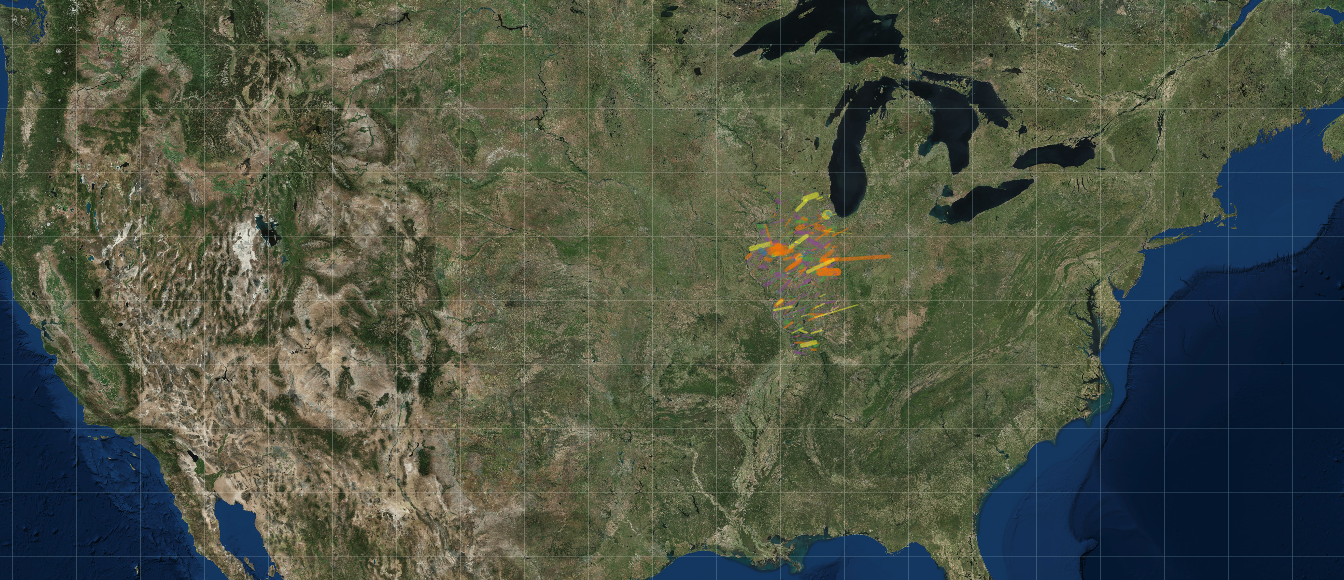
View Final Release

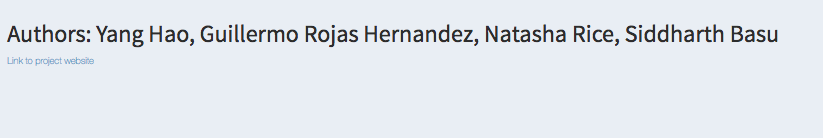
Guillermo Rojas Hernandez progress:
Yang Hao progress:
Natasha Rice progress:
Siddharth Basu progress:
Guillermo Rojas Hernandez progress:
Yang Hao progress:
Natasha Rice progress:
Siddharth Basu progress:
Guillermo Rojas Hernandez progress:
Yang Hao progress:
Natasha Rice progress:
Siddharth Basu progress:
The data utilized was chosen by the professor of the course, Dr. Andy Johnson.
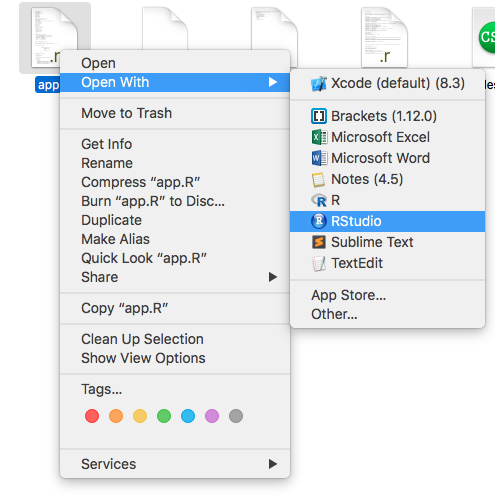
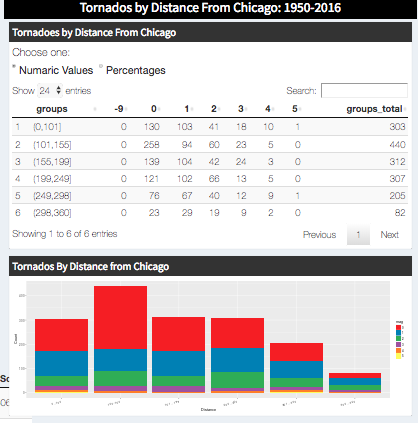
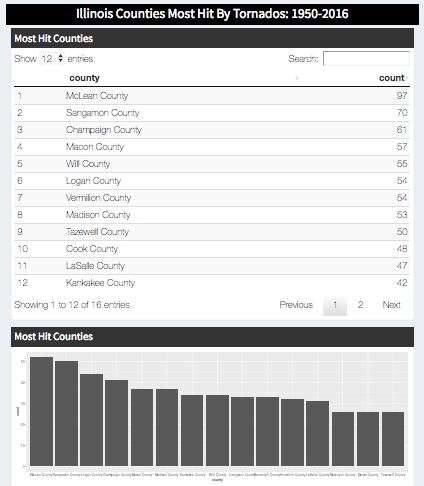
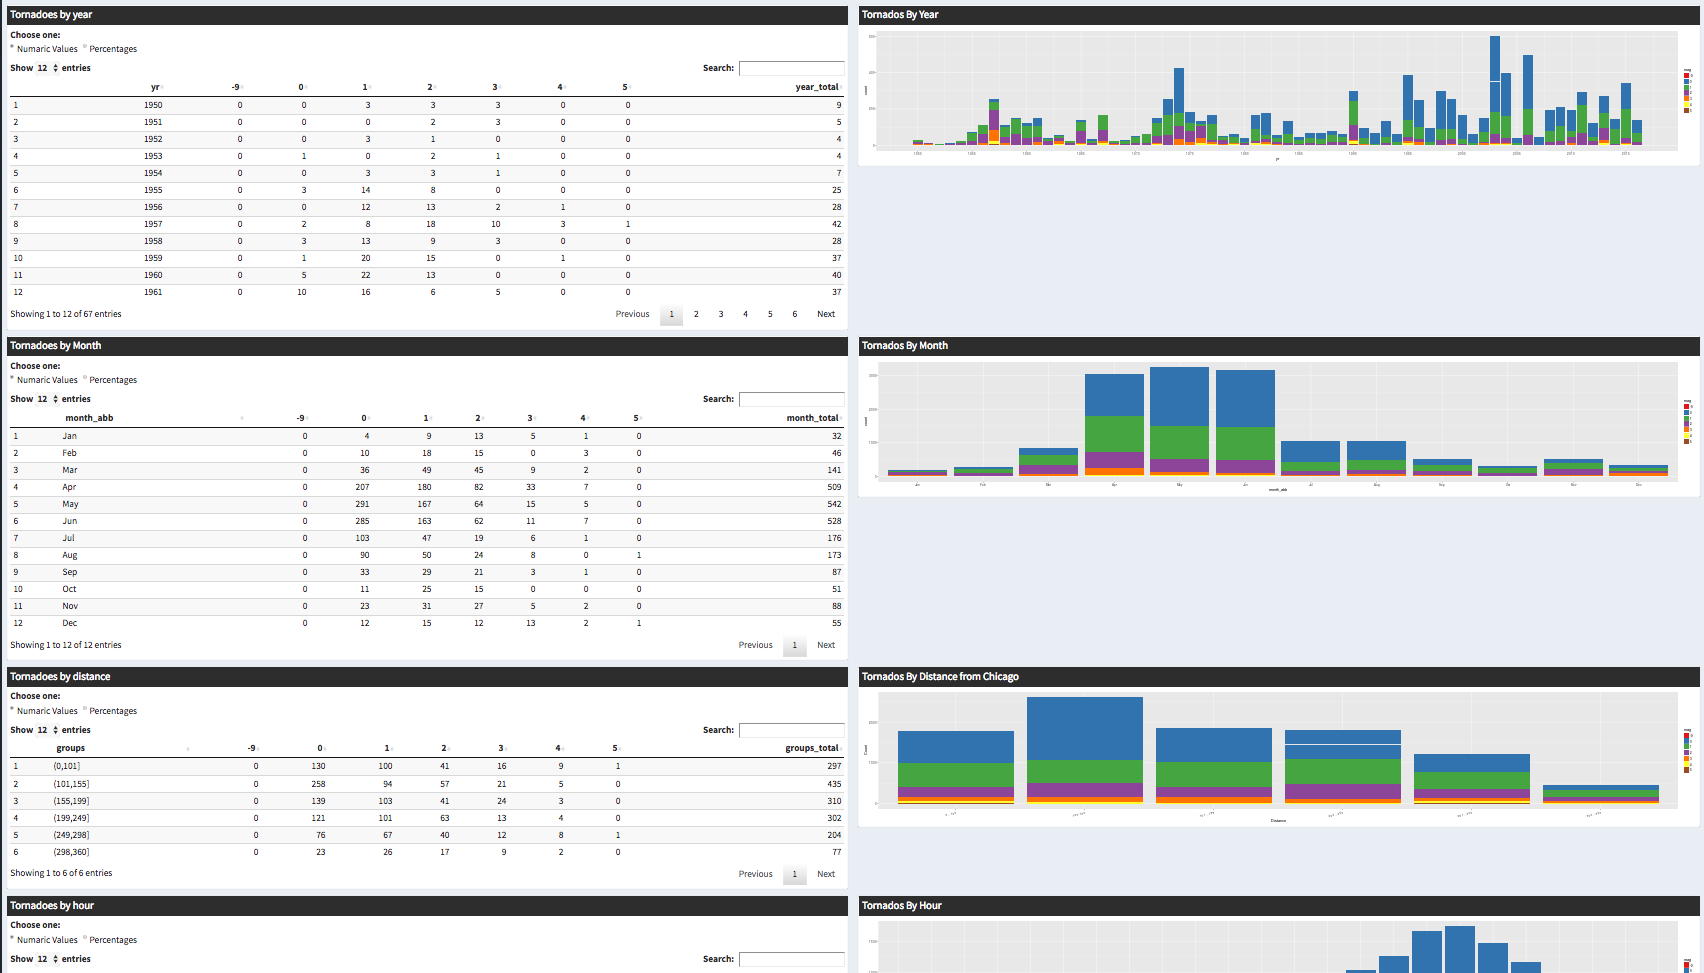
For the application, we created bar charts and pie charts using the ggplot library once the data was processed into R Studio.
Data Manipulation
Libraries Used: